
Frequently Asked Questions
- Who is responsible for this web site?
- What is available on this site?
- What is the difference between a WSC Product and a WSC Output?
- How many hydrometric stations do you operate?
- What hydrometric data are measured?
- How are daily mean calculated?
- How are the Wateroffice statistics calculated?
- What is the definition of current conditions?
- How do I view data?
- How is real-time discharge (or streamflow) measured?
- What does "real-time" data really mean?
- What is the timeliness of the real-time data?
- How long are real-time data available on the web site?
- How do I get data older than 18 months?
- How do I Download more than 7 Days of Realtime Data?
- Can I save stations so I don’t have to search for them again?
- When using the map search, why do I see station(s) in a different province/territory than what I selected from the drop down list?
- How do ice conditions affect water level and discharge data values?
- What do the Approval and Grade mean?
- What does 'assumed datum' mean?
- What does RHBN mean?
- How should I reference data?
Who is responsible for this web site?
This site is maintained by Water Survey of Canada (WSC), within the National Hydrologic Services, Environment and Climate Change Canada. The WSC is the federal organization responsible for the collection, interpretation, and dissemination of standardized water quantity data and information in Canada. WSC operates the network of hydrometric monitoring stations on behalf of most provinces and territories under federal-provincial or federal-territorial agreements. In the case of Quebec, the province operates the stations to collect water quantity data under a similar agreement.
What is available on this site?
This site provides “real-time” hydrometric (water quantity) data from over 1900 stations on rivers, streams, and lakes across Canada, as well as access to historical hydrometric data, such as (archived) historical daily means.
What is the difference between a WSC Product and a WSC Output?
WSC Product: Data that has undergone all relevant quality management processes. WSC Products are typically available on this website.
Examples: Water level and discharge time-series data
WSC Output: Data that does not receive a standardized level of quality assurance. Outputs are auxiliary data used to support the production of WSC Products and are typically not publicly available on this website.
Example: Field visit observations, Station health parameters, Water temperature
How many hydrometric stations do you operate?
The WSC operates more than 2200 hydrometric stations, all recording data on site. However, about ninety percent of these stations transmit data to this web site in real-time, using either satellite or telephone communication systems.
What hydrometric data are measured?
The two main water quantity variables are water level, and streamflow (also known as discharge). However some stations also collect and publish other environmental parameters such as air and water temperature.
How are daily mean calculated?
Daily means are time-weighted average of the 5-minute data between 0:00 and 24:00. Values are interpolated at 0:00 and 24:00 if not available and if there is no gap* at the beginning/end of the day. We exclude unusable grades and do not apply a weight between gaps. *gap = 121 min without data.
How do I view data?
You can do a station search by station name (e.g., “Graham Creek”) or Station Number (e.g.. “02KF015”), or browse a list of stations refined by an area (Province or Territory, Drainage Basin, Water Survey of Canada (WSC) Region or geographical coordinates). You can also use the Map Search to select stations of interest and to view current hydrometric conditions at these stations. Data are presented in simple graphical and tabular formats.
How is real-time discharge (or streamflow) measured?
Real-time discharge (or streamflow) is not measured directly. At each station, water level data (also known as stage) are recorded continuously in digital form using a water level sensor connected to an automated electronic recorder, or data logger. The continuous water level data are then used to determine continuous (real-time) discharge using a stage-discharge model.
To develop the model, a WSC hydrometric technologist visits the station several times a year to take direct measurements of discharge and water level. The technologist takes these direct measurements of discharge by deploying specialty instruments, from a bridge, by wading in a stream, by boat, or using a cableway strung across a river.
Once the relationship between water level and discharge has been established, through the development of stage-discharge curves, discharge values are derived continuously from the recorded and transmitted (real-time) water level data.
In the office, the WSC technologists review and finalize the data under a rigorous quality management process. The data are stored in the national database and disseminated to users via the web site.
What does "real-time" data really mean?
Using various telecommunication systems, water level and streamflow conditions at over 1900 hydrometric stations can be reported on this web site within hours of their measurement. This is referred as "real-time" data.
What is the timeliness of the real-time data?
We aim to provide real-time unit value data (e.g., 5 minute data) to the public within 6 hours of recording in the field, but they are often available much sooner. The data are transmitted by satellite or land-line (telephone) directly from the gauging station to our data centre. Satellite transmissions are scheduled every 1 to 3 hours. The "polling" of land-line stations is done as often as once every hour or as little as once every day, depending on the requirement.
It takes up to six hours to reach the web page because data from all of our over 1900 real-time gauging stations must be transmitted from the field, processed in our hydrometric data computation system, and then transferred to our web site on a continuous basis (that’s about 25000 independent data points per hour!).
How long are real-time data available on the web site?
Real-time data are available on the Wateroffice web site for a maximum of 18 months. The latest 1 month of data are being continually refreshed to provide the best available data in terms of their quality approval status. The remaining 17 month data are refreshed overnight. So the entire data set are updated daily.
How do I get data older than 18 months?
You can access historical water level and streamflow data either by selecting a station and viewing historical data in tabular form, or by downloading the HYDAT Database.
How do I Download more than 7 Days of Realtime Data?
After selecting a Station, you are able to ‘Download’ the last 7 days of provisional data by selecting the ‘Download’ Button right away. To download data older than 7 days you will need to continue onto the View Report Page and manually adjust the ‘Date Parameters’ to the desired dates and select ‘Apply Settings’. After the data has generated on the page, you are then able to select the ‘Download’ button that will bring you to the Real-Time Hydrometric Data Download page to choose your desired output format.
Can I save stations so I don’t have to search for them again?
Yes! You can customize a 'my station list' and display data summaries for stations of interest. This feature allows you to quickly check water level or streamflow conditions at these stations each time you return to the web site.
When using the map search, why do I see station(s) in a different province/territory than what I selected from the drop down list?
The province/territory drop down list indicates the Water Survey of Canada location from which data are published, while the map displays the physical location(s) of the station(s).
How do ice conditions affect water level and discharge data values?
You can find out more information on how the presence of ice in a stream impacts the water level and stage-discharge relationship and why the data spikes or dips are presented on the real-time hydrograph.
What do the Approval and Grade mean?
| Approval Name | Description |
|---|---|
| PROVISIONAL | Data provided is best available and is subject to change. |
| FINAL | Data confirmed to capture all observations and meeting all quality standards. |
| Grade | Name | Description |
|---|---|---|
| 10 | ICE | Data for which ice conditions and processes may have caused backwater, affecting the stage-discharge relationship. |
| 20 | ESTIMATED | Discharge data that were estimated using an alternative to the station's stage-discharge model. |
| 30 | PARTIAL DAY | Applies to daily mean values that include missing periods larger than 120 consecutive minutes in the same day. |
| 40 | DRY | The water level has dropped below the lowest limit possibly observed by the sensor. This may or may not indicate a dry gauging pool. |
| 50 | REVISED | Previously approved data that were subsequently reviewed and edited. |
What does 'assumed datum' mean?
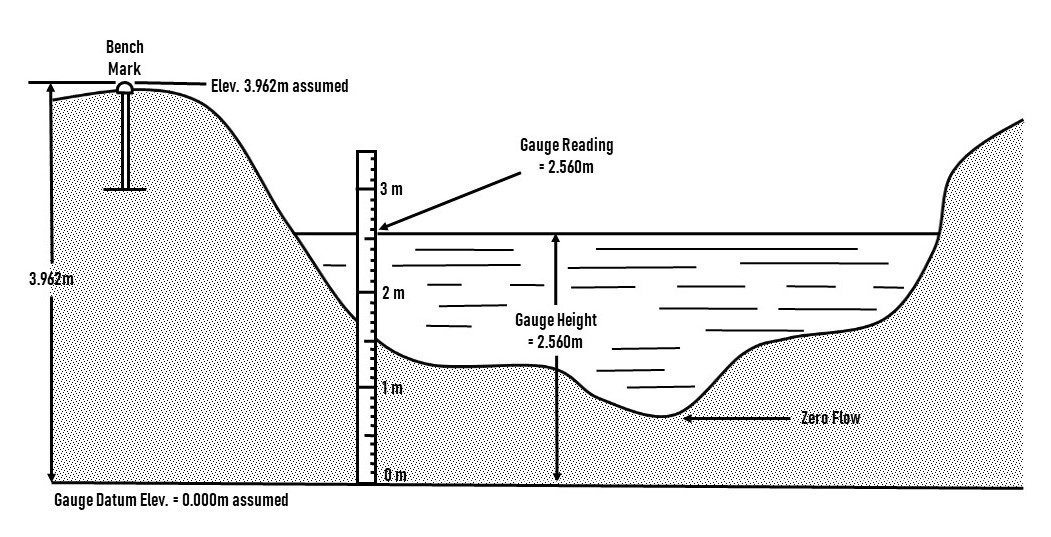
National Hydrological Services often reports the water level (i.e. the Gauge Height) above an assumed datum (also called an assumed reference system). An assumed datum is an arbitrary local coordinate system. In the diagram below, the 'Gauge Reading' indicates the level of the water above the assumed datum and does not reflect the 'depth' of the water, nor its height above sea level.
For additional frequently asked questions about datums.
What does RHBN mean?
The Reference Hydrometric Basin Network (RHBN) is a sub-set of the national network that has been identified for use in the detection, monitoring, and assessment of climate change. It is part of Canada's contribution to the Global Climate Observing System (GCOS).
How should I reference data?
For real-time data retrieved from the Wateroffice web site:
“Extracted from the Environment and Climate Change Canada Real-time Hydrometric Data web site (https://wateroffice.ec.gc.ca/mainmenu/real_time_data_index_e.html) on [DATE]”
For historical data retrieved from the Wateroffice web site:
“Extracted from the Environment and Climate Change Canada Historical Hydrometric Data web site (https://wateroffice.ec.gc.ca/mainmenu/historical_data_index_e.html) on [DATE]”
For historical data retrieved from the MDB file:
“Extracted from Environment and Climate Change Canada’s HYDAT.mdb, released on [DATE]”
Page details
- Date modified: